
ZEFFER RESEARCH

Research Timeline

A dated archive of Zeffer research—and why it matters to the economy and markets.

Research pieces
38
Collections
1
Forthcoming overviews
2
Files
71

Archive snapshot · November 19, 2026 · Pacific time

Archive entries

November 202626 entries

Date basis: Editorial edition / research snapshot

  • Infographic
  • Economy

Two Pills. One Economy.

Source Research snapshot November 19, 2026. Companion Source Guide: The facts behind the strings, 5 pages, with numbered references, metric definitions and observation dates.

Zeffer Research infographic titled Two Pills. One Economy. A tall blue good-news board sits above a red risks and financial connections board, with source references and the original information-only, not-investment-advice disclaimer. Research snapshot November 19, 2026.
Original economic infographic · Research snapshot November 19, 2026. Source references and disclaimer are retained in the artwork.
Why it matters

Strong profits and real demand can coexist with fragile financing and expensive commitments. The blue and red boards distinguish supportive evidence from possible stress channels; they are not trading signals.
Date basis: Evidence date; website update November 14, 2026 at 5:31 p.m. PST

  • Report
  • Governance

FAA ground stop — Updated public findings

Source Updated public findings · 22 pages.

Why it matters

Operational resilience and procurement oversight matter to essential infrastructure. Officials identified overloaded legacy telecommunications equipment; documented relationships do not establish wrongdoing or that SMART caused the outage.

Date basis: Publication / edition date

  • Chart
  • Valuations

How big can Wall Street get relative to Main Street?

Source Federal Reserve Z.1 via FRED, BOGZ1LM883164115Q; BEA via FRED, GDP. Formula: equity value in $ millions ÷ 1,000 ÷ GDP in $ billions × 100. Retrieved November 12, 2026.

Zeffer Research Chart of the Day, November 12, 2026: Buffett indicator, public domestic corporate equity value divided by annualized nominal GDP. Q2 2026 is 287.5%, with $93.61 trillion public equity value and $32.56 trillion annualized GDP. Quarterly observations span Q4 1947–Q2 2026. This is a quarterly historical valuation measure, not a live market quote or a forecast. Full approved explanations and source notes appear in the original artwork.
Original Chart of the Day · November 12, 2026. Observation period: Q2 2026; not a live valuation measure.
Why it matters

Equity market value and current economic output measure different things. Their relationship frames questions about earnings expectations and valuation, not a mechanical trading rule.

Original files

Date basis: Publication / edition date

  • Chart
  • Valuations

The price you pay shapes the decade you get

Source Robert J. Shiller, shillerdata.com, ie_data.xls, Data sheet. Standard CAPE and reported forward real total returns. Zeffer calculations and chart. Retrieved November 12, 2026.

Zeffer Research Chart of the Day, November 12, 2026: CAPE and annualized real total returns over the following ten years. October 2026 CAPE is marked at 40.7. Historical starting points run from January 1881 through October 2016. The recent marker has no completed ten-year outcome and is not a forecast. Full approved explanations and source notes are included in the original artwork.
Original Chart of the Day · November 12, 2026. Observation period: October 2026; not a live valuation measure.
Why it matters

Starting valuations can shape the range of long-horizon returns even when business growth is strong. Historical relationships are context, not a forecast.

Original files

Date basis: Catalog overview date

  • Overview
  • Insurance
  • Forthcoming overview
  • Catalog only

Life Insurance Guarantees: Private Assets, Public Exposure

Source Forthcoming paper · Illustrated research overview.

A protective shield and insurance documents on a desk, with illuminated connections between institutional buildings in the background.
Original research overview illustration · November 12, 2026.
Why it matters

This overview examines how insurer asset exposures and limited guaranty arrangements can transmit risks across firms and jurisdictions. It does not describe an unlimited taxpayer guarantee.

Catalog overview only. No full paper is available for download.

Original files

Date basis: Catalog overview date

  • Overview
  • Credit
  • Forthcoming overview
  • Catalog only

Neoclouds: The Debt That Could Break Them

Source Forthcoming paper · Illustrated research overview.

GPU server racks behind a brass balance scale weighing a chip against stacks of financing documents, with an hourglass and pen on a desk.
Original research overview illustration · November 12, 2026.
Why it matters

This overview asks how capital-intensive AI providers fund their obligations and where lender control sits if cash generation disappoints. It does not assert an existing default or covenant breach.

Catalog overview only. No full paper is available for download.

Original files

Date basis: Collection date only; original publication date not recorded

  • Infographic
  • AI economics

The AI Token Paradox

Source November 11, 2026 collection, page 6. Source notes remain in the original artwork.

Why it matters

Falling unit costs need not imply falling aggregate spending. The graphic asks how adoption, usage and revenue capture interact.

Date basis: Collection date

  • Collection
  • Cross-market

Infographic Collection — November 11, 2026 Update

Source November 11, 2026 collection · 21 pages containing 18 graphics.

Why it matters

A fixed snapshot brings related work on AI economics, financing, governance and portfolio choices into one document. The bundle preserves its original contents rather than tracking additions to the live catalog.

Collection bundle · 18 graphics also listed individually.

Date basis: Collection date only; original publication date not recorded

  • Infographic
  • Governance

Corruption in America

Source November 11, 2026 collection, page 19. Source notes remain in the original artwork.

Why it matters

Institutional incentives and oversight affect how resources and influence are allocated. The graphic offers a research lens, not an independent finding of wrongdoing.

Date basis: Collection date only; original publication date not recorded

  • Infographic
  • Credit

Credit Cracks Are Spreading

Source November 11, 2026 collection, page 10. Source notes remain in the original artwork.

Why it matters

Credit stress can appear through markdowns, nonaccruals and changes in payment terms. Connecting the indicators helps frame potential transmission channels without asserting inevitable contagion.

Date basis: Collection date only; original publication date not recorded

  • Infographic
  • Credit

The AI Debt Maturity Wall

Source November 11, 2026 collection, page 9. Source notes remain in the original artwork.

Why it matters

Refinancing dates can matter as much as total debt. Concentrated maturities link operating performance to future funding conditions.

Date basis: Collection date only; original publication date not recorded

  • Infographic
  • Economy
  • Scenario

Energy-for-Treasuries Exchange

Source November 11, 2026 collection, page 20. Source notes remain in the original artwork.

Why it matters

Energy arrangements and demand for financial assets can link geopolitics to capital flows. The framework explores a possible transmission channel rather than a verified future agreement.

Date basis: Collection date only; original publication date not recorded

  • Infographic
  • Portfolio choices
  • Scenario

Volatility Hedging Playbook

Source November 11, 2026 collection, page 15. Source notes remain in the original artwork.

Why it matters

Hedges have costs, timing risks and imperfect relationships to the exposures they aim to offset. The playbook organizes those trade-offs rather than promising protection.

Date basis: Collection date only; original publication date not recorded

  • Infographic
  • AI economics

The AI Cash Flow Test: Microsoft, Alphabet & Amazon

Source November 11, 2026 collection, page 8. Source notes remain in the original artwork.

Why it matters

Operating cash flow and capital spending together show the funding burden beneath AI investment. Comparing companies requires attention to periods and cash-flow definitions.

Date basis: Collection date only; original publication date not recorded

  • Infographic
  • Portfolio choices

Ivy-Plus Endowment Investing

Source November 11, 2026 collection, page 13. Source notes remain in the original artwork.

Why it matters

Institutional portfolios face liquidity and valuation trade-offs alongside long investment horizons. Endowment structures are context, not a template for every investor.

Date basis: Publication / edition date

  • Infographic
  • Governance

NVIDIA: Who Checks Jensen?

Source November 11, 2026 collection, page 4. Source notes remain in the original artwork.

Why it matters

Formal board powers and founder influence need not be identical. The graphic frames oversight and independence questions using its contemporaneous source record.

Date basis: Collection date only; original publication date not recorded

  • Infographic
  • Economy

Peak Earnings, Hidden Fragility

Source November 11, 2026 collection, page 12. Source notes remain in the original artwork.

Why it matters

Strong aggregate earnings can coexist with vulnerable financing structures. Looking beneath totals helps identify where resilience and fragility may diverge.

Date basis: Collection date only; original publication date not recorded

  • Infographic
  • Portfolio choices
  • Scenario

Balancing Your Portfolio in a Risk-Off Era

Source November 11, 2026 collection, page 17. Source notes remain in the original artwork.

Why it matters

Portfolio construction involves trade-offs among concentration, liquidity and correlated exposures. The framework explores choices rather than guaranteeing risk reduction.

Date basis: Collection date only; original publication date not recorded

  • Infographic
  • Credit

Ratings Shopping: Incentives Then and Now

Source November 11, 2026 collection, page 11. Source notes remain in the original artwork.

Why it matters

Rating incentives can affect how investors interpret credit assessments. The comparison asks how issuer, agency and investor interests interact.

Date basis: Collection date only; original publication date not recorded

  • Infographic
  • Portfolio choices
  • Scenario

Risk-Off Investment Guide

Source November 11, 2026 collection, page 16. Source notes remain in the original artwork.

Why it matters

A defensive framework compares liquidity, diversification and downside exposure. It is an educational scenario guide, not a personalized allocation recommendation.

Date basis: Collection date only; original publication date not recorded

  • Infographic
  • AI economics

The Price of AI Is Falling: Token Costs & Open Models

Source November 11, 2026 collection, page 7. Source notes remain in the original artwork.

Why it matters

Lower inference prices and open models can expand adoption while challenging supplier pricing power. Usage growth and revenue capture should be assessed separately.

Date basis: Collection date only; original publication date not recorded

  • Infographic
  • AI economics
  • Scenario

Warning: New Developments Make the AI Trade More Perilous

Source November 11, 2026 collection, page 5. Source notes remain in the original artwork.

Why it matters

Capital spending, falling prices and leveraged financing can interact. The risk loop is a framework for examining feedback channels, not a claim that a particular outcome must follow.

Date basis: Collection date only; original publication date not recorded

  • Infographic
  • Portfolio choices
  • Scenario

What to Short, When

Source November 11, 2026 collection, page 14. Source notes remain in the original artwork.

Why it matters

Short positions introduce timing, financing and potentially unbounded loss risks. The framework is a scenario discussion rather than an instruction to trade.

Date basis: Collection date only; original publication date not recorded

  • Infographic
  • Governance

Who Can Fire the CEO?

Source November 11, 2026 collection, page 18. Source notes remain in the original artwork.

Why it matters

Board authority and ownership structures shape executive accountability. The graphic frames who can exercise control and under which institutional constraints.

October 20261 entry

Date basis: Public V1 edition date

  • Report
  • Credit

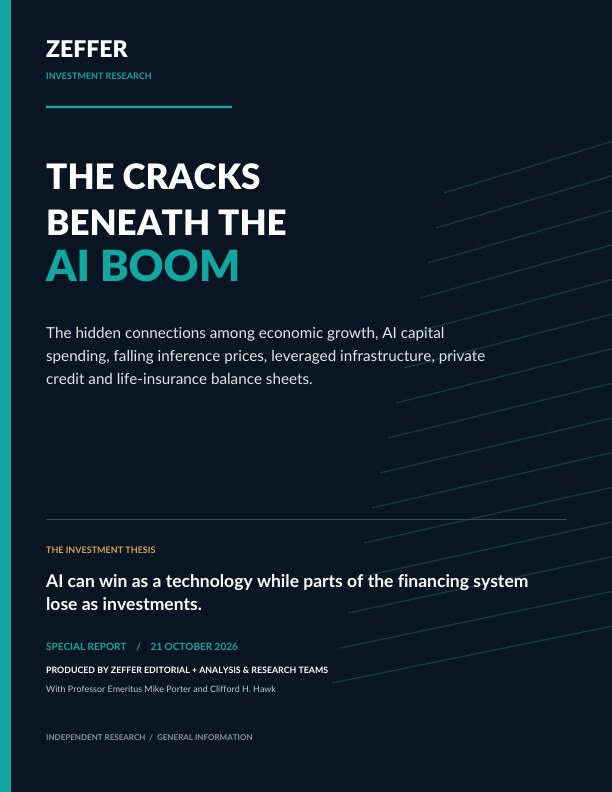
The Cracks Beneath the AI Boom

Source October 21, 2026 public V1 · 41 pages.

Original cover of The Cracks Beneath the AI Boom, Zeffer public V1 research report.
Original research cover · Public V1, October 21, 2026 · 41 pages.
Why it matters

AI can succeed as a technology while some financing structures disappoint investors. This paper examines how capital commitments, credit exposure and cash generation can connect the technology cycle to financial risk.

Publication date not recorded14 entries

Publication date not recorded

Date basis: Original publication date not recorded

  • Infographic
  • Economy

October 2026 CPI: Headline Slowed. Core Held Steady.

Publication date not recorded

Source Source: U.S. Bureau of Labor Statistics, October 2026 CPI release, November 10, 2026.

Why it matters

Headline and core inflation can move differently. The distinction matters for purchasing power, rate expectations and financing decisions.

Publication date not recorded

Date basis: Original publication date not recorded

  • Infographic
  • Credit

CoreWeave: What Made Up Operating Cash Flow?

Publication date not recorded

Source Source: CoreWeave Q3 2026 earnings release, SEC Form 8-K exhibit. No release day is printed.

Why it matters

Deferred revenue can support reported operating cash flow while committing a business to future delivery. Cash-flow composition matters alongside the headline total.

Publication date not recorded

Date basis: Original publication date not recorded

  • Infographic
  • Infrastructure

Duke Energy Florida: How Much Collateral Would Duke Hold?

Publication date not recorded

Source Source: Florida PSC staff memorandum, October 22, 2026, §13.04.

Why it matters

Large-load collateral proposals allocate risk between customers, utilities and ratepayers. Different contractual bases can produce materially different protections.

Publication date not recorded

Date basis: Original publication date not recorded

  • Infographic
  • Infrastructure

EIA November 2026 Outlook: Power Generation Growth Slows

Publication date not recorded

Source Source: U.S. EIA Short-Term Energy Outlook, November 10, 2026.

Why it matters

Power-demand estimates and forecasts inform infrastructure planning but are not realized outcomes. Weather assumptions can change the demand outlook and investment case.

Publication date not recorded

Date basis: Original publication date not recorded

  • Infographic
  • Credit

Energy Vault: What’s in the $236.2M Cash Total?

Publication date not recorded

Source Source: Energy Vault Q3 2026 earnings release, filed as an SEC exhibit. No release day is printed.

Why it matters

Restricted cash is not interchangeable with freely available liquidity. Cash composition helps frame how much financial flexibility a headline total actually represents.

Publication date not recorded

Date basis: Original publication date not recorded

  • Infographic
  • Credit

Federal Reserve: Private Credit Exposure Varies by Vehicle

Publication date not recorded

Source Source: Federal Reserve FEDS Notes, U.S. Private Credit Vehicles, November 9, 2026. Observations: year-end 2025.

Why it matters

Investment vehicles can carry very different private-credit exposures. Their asset mix affects how financing stress might be transmitted across investors and intermediaries.

Publication date not recorded

Date basis: Original publication date not recorded

  • Infographic
  • Infrastructure

GE Vernova Gas Power: Orders and Reservations

Publication date not recorded

Source Source: GE Vernova Q3 2026 earnings release, October 28, 2026.

Why it matters

Equipment backlog and capacity reservations are not interchangeable. Tracking the distinction helps assess investment commitments and the conversion of demand into orders.

Publication date not recorded

Date basis: Original publication date not recorded

  • Infographic
  • Business economics
  • Illustrative example

Illustrative Sign-Up Funnel: The Average Stayed Flat. A Segment Fell.

Publication date not recorded

Source Illustrative example only. Counts are sign-ups divided by visitors; no external source or date is printed.

Why it matters

A changing customer mix can obscure deterioration within a segment. This is a constructed teaching example, not observed Zeffer customer or engagement data.

Publication date not recorded

Date basis: Original publication date not recorded

  • Infographic
  • Credit

KBRA: Credit Stress Is Higher for Smaller Borrowers

Publication date not recorded

Source Source: KBRA, Q3 2026 Middle Market Compendium, November 5, 2026.

Why it matters

Borrower size and the definition of default influence measured credit stress. These distinctions matter when comparing portfolio risk and refinancing capacity.

Publication date not recorded

Date basis: Original publication date not recorded

  • Infographic
  • Credit

Nebius Expects More Customer Prepayments

Publication date not recorded

Source Source: Nebius Q3 2026 shareholder letter, November 12, 2026.

Why it matters

Customer prepayments can help fund infrastructure but also create delivery obligations. Compare management expectations with the scale and timing of planned capital commitments.

Publication date not recorded

Date basis: Original publication date not recorded

  • Infographic
  • AI economics

RevenueCat: AI Apps Convert More Trials, but Retain Less

Publication date not recorded

Source Source: RevenueCat, State of Subscription Apps 2026. No release day is printed.

Why it matters

Trial conversion and ongoing retention measure different customer populations. Evaluating both helps distinguish initial AI demand from durable subscription economics.

Publication date not recorded

Date basis: Original publication date not recorded

  • Infographic
  • Infrastructure

Siemens Energy: The Path to a 20–22% Margin Target

Publication date not recorded

Source Source: Siemens Energy Q4 FY 2026 earnings release, November 11, 2026.

Why it matters

Actual margins, guidance and targets are different evidence categories. Their progression frames the execution assumptions behind energy-infrastructure expectations.

Publication date not recorded

Date basis: Original publication date not recorded

  • Infographic
  • Infrastructure

Statnett: Data-Center Capacity on Norway’s Grid

Publication date not recorded

Source Source: Statnett’s November 9, 2026 notice on new capacity reservations.

Why it matters

Connected power capacity is not the same as reservations, queues or inquiries. Those differences help explain how grid constraints can affect the pace of data-center investment.

Publication date not recorded

Date basis: Original publication date not recorded

  • Infographic
  • Infrastructure

Sterling Infrastructure: What’s in the $6.14B Backlog?

Publication date not recorded

Source Source: Sterling Infrastructure Q3 2026 earnings release, October 28, 2026.

Why it matters

Signed backlog and unsigned awards carry different execution risks. Distinguishing them helps assess how demand may translate into future work and cash generation.

The facts behind the strings

A companion to Two Pills. One Economy., with numbered references, metric definitions and observation dates. Research snapshot: November 19, 2026.

Preservation packages

Download all three PDF parts for the complete set of 38 PDFs. Images and artwork are in a separate ZIP. The manifest lists filenames, source links, date details and checksums.

Download manifest

Dates identify publication or edition records unless a collection or source-date basis is stated; unknown dates remain unrecorded. Archive capture timestamps are separate.

Educational research archive. Entries describe questions, evidence and scenarios; they are not investment advice or recommendations to buy or sell any security.